

The U.S. IPO market is now entering a dense wave of large-scale equity issuance, and the hottest question in the market is: will this 'massive supply' trigger a liquidity drain and crush U.S. stocks?
Deutsche Bank strategists including Binky Chadha recently gave a clear answer. After systematically reviewing historical data from multiple equity-issuance cycles over the past several decades and combining academic literature with empirical research, they concluded that equity issuance waves usually coincide with strong stock market performance rather than causing declines.
Strategist Jim Reid said this is one of the questions he hears most often from clients right now. His judgment is that this concern is often mis-timed in historical terms.
The bank also acknowledged that large IPOs can indeed weigh on the market by around 1% in isolation, but every one to two months U.S. stocks fall 3% or more for various reasons, so IPO supply is just one of many factors.
How big is the IPO wave? First, look at the scale
U.S. equity issuance has kept rising since early 2023, with quarterly issuance climbing from a low of about $30 billion to roughly $120 billion now. SpaceX is nearing an IPO.
Over the next few months, several highly watched mega-cap companies, including OpenAI, are expected to list one after another, with single deals potentially reaching tens of billions of dollars.
Sounds scary? But when viewed across the whole market, even the largest expected IPO would account for only a little more than 0.1% of the S&P 500's total market value.
The investor logic is this: new shares need cash, so buyers have to free up money, which means selling old stocks and pressuring the overall market. That sounds reasonable, but the data do not support it.
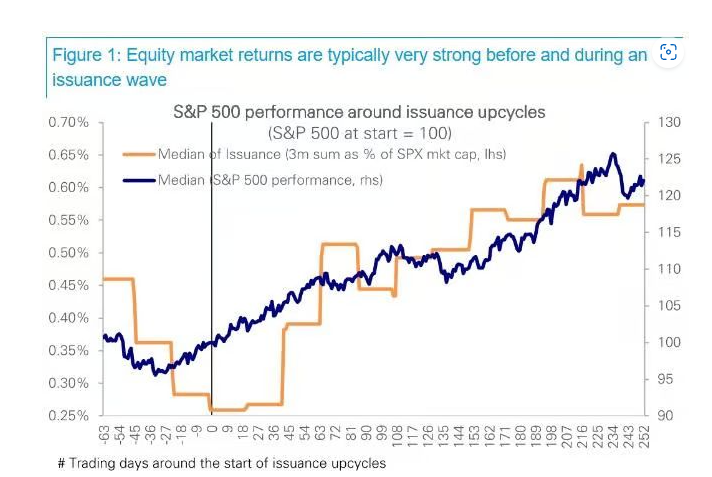
Historical pattern: stocks often perform better during IPO peaks
Over the past 30 years, during multiple issuance peaks, the median U.S. stock return has looked like this: about 8% over three months and more than 20% over 12 months.
Why does this happen? The logic is straightforward: companies choose to go public because demand is strong, profit momentum is healthy, and investors are eager to take risk.
In other words, strong markets create IPOs, not the other way around.
Academic research does find that issuance waves are eventually followed by weaker returns — but the key word is 'eventually', and that often takes a long time. By then, the market has usually already risen a lot.
The only exception was the 2008-2009 financial crisis. In that period, equity issuance was forced and took place against a backdrop of systemic stress, so the situation was completely different.
How much pressure does supply create? Stronger demand is the key
From a supply-demand perspective, large IPOs can indeed weigh on the market by around 1% in isolation, and a dense schedule of new issues may also create short-term volatility.
But shocks of that size are not unusual. Every one to two months, U.S. stocks pull back 3% or more for various reasons, and IPO supply is only one of many factors.
More importantly, demand is currently very strong: money is still flowing in, earnings growth is steady, overall equity positioning remains relatively moderate, buybacks are active, and household balance sheets still have plenty of room to absorb new supply.
'Strong demand, not excess supply, may be the defining feature of this IPO wave.' That is the core judgment from Chadha's framework.
Is this 1999, or 2000?
Deutsche Bank used a vivid analogy to describe the current market state: 'It feels like 1999, not 2000.'
The implication is that the party is not over yet, but it will end eventually. Returns do weaken after an issuance wave, but the timing is hard to pin down, and before that the market often still has a strong run.
So Deutsche Bank says that whether or not we ultimately reach 2000, this still feels like 1999 right now.